A first descriptive analysis#
One of the best ways to get started with the OULAD analysis might be to explore the original paper that introduced the OULAD dataset. [KHZ17]
In this section we try to reproduce and summarize their findings. We also take some notes at the end which might be used later.
Jakub Kuzilek, Martin Hlosta, and Zdenek Zdrahal. Open university learning analytics dataset. Scientific Data, 4:170171, Nov 2017. doi:10.1038/sdata.2017.171.
import matplotlib.pyplot as plt
import pandas as pd

from oulad import get_oulad

%reload_ext oulad.capture
%%capture oulad
oulad = get_oulad()
General statistics#
module_count = oulad.courses.code_module.nunique()
print(
    "OULAD contains data about:\n"
    f"  - {oulad.courses.shape[0]} courses from {module_count} modules "
    "(4 STEM modules and 3 Social Sciences modules)\n"
    f"  - {oulad.student_info.shape[0]} students\n"
    f"  - {oulad.student_registration.shape[0]} student registrations\n"
    f"  - {oulad.student_vle.shape[0]} VLE interaction entries"
)
OULAD contains data about:
  - 22 courses from 7 modules (4 STEM modules and 3 Social Sciences modules)
  - 32593 students
  - 32593 student registrations
  - 10655280 VLE interaction entries
Student registration count by module with domain information#
registration_count = (
    oulad.student_registration.groupby(
        ["code_module", "code_presentation"], as_index=False
    )
    .count()
    .groupby(["code_module"])
    .agg(
        presentations=pd.NamedAgg(column="code_presentation", aggfunc="count"),
        students=pd.NamedAgg(column="id_student", aggfunc="sum"),
    )
)
oulad.domains.join(registration_count, on="code_module")
| code_module | domain | presentations | students | |
|---|---|---|---|---|
| 0 | AAA | Social Sciences | 2 | 748 |
| 1 | BBB | Social Sciences | 4 | 7909 |
| 2 | CCC | STEM | 2 | 4434 |
| 3 | DDD | STEM | 4 | 6272 |
| 4 | EEE | STEM | 3 | 2934 |
| 5 | FFF | STEM | 4 | 7762 |
| 6 | GGG | Social Sciences | 3 | 2534 |
Student registration count by module-presentation#
registration_count = oulad.student_registration.groupby(
    ["code_module", "code_presentation"]
).size()
registration_count.reset_index()
| code_module | code_presentation | 0 | |
|---|---|---|---|
| 0 | AAA | 2013J | 383 |
| 1 | AAA | 2014J | 365 |
| 2 | BBB | 2013B | 1767 |
| 3 | BBB | 2013J | 2237 |
| 4 | BBB | 2014B | 1613 |
| 5 | BBB | 2014J | 2292 |
| 6 | CCC | 2014B | 1936 |
| 7 | CCC | 2014J | 2498 |
| 8 | DDD | 2013B | 1303 |
| 9 | DDD | 2013J | 1938 |
| 10 | DDD | 2014B | 1228 |
| 11 | DDD | 2014J | 1803 |
| 12 | EEE | 2013J | 1052 |
| 13 | EEE | 2014B | 694 |
| 14 | EEE | 2014J | 1188 |
| 15 | FFF | 2013B | 1614 |
| 16 | FFF | 2013J | 2283 |
| 17 | FFF | 2014B | 1500 |
| 18 | FFF | 2014J | 2365 |
| 19 | GGG | 2013J | 952 |
| 20 | GGG | 2014B | 833 |
| 21 | GGG | 2014J | 749 |
max_id = registration_count.idxmax()
min_id = registration_count.idxmin()
print(
    f"The largest module-presentation {max_id} contains "
    f"{registration_count[max_id]} student registrations.\n"
    f"The smallest module-presentation {min_id} contains "
    f"{registration_count[min_id]} student registrations. \n"
    f"The average module-presentation registration count is "
    f"{registration_count.mean()}."
)
The largest module-presentation ('CCC', '2014J') contains 2498 student registrations.
The smallest module-presentation ('AAA', '2014J') contains 365 student registrations.
The average module-presentation registration count is 1481.5.
Student assessment count#
exams = oulad.assessments[oulad.assessments.assessment_type == "Exam"]
print(
    f"The student_assessment table contains {oulad.student_assessment.shape[0]} rows."
    "\n"
    f"The assessment tabel contains {exams.shape[0]} Exams.\n"
    f"{pd.merge(oulad.student_assessment, exams, on='id_assessment').shape[0]} "
    "student_assessments are Exams."
)
The student_assessment table contains 173912 rows.
The assessment tabel contains 24 Exams.
4959 student_assessments are Exams.
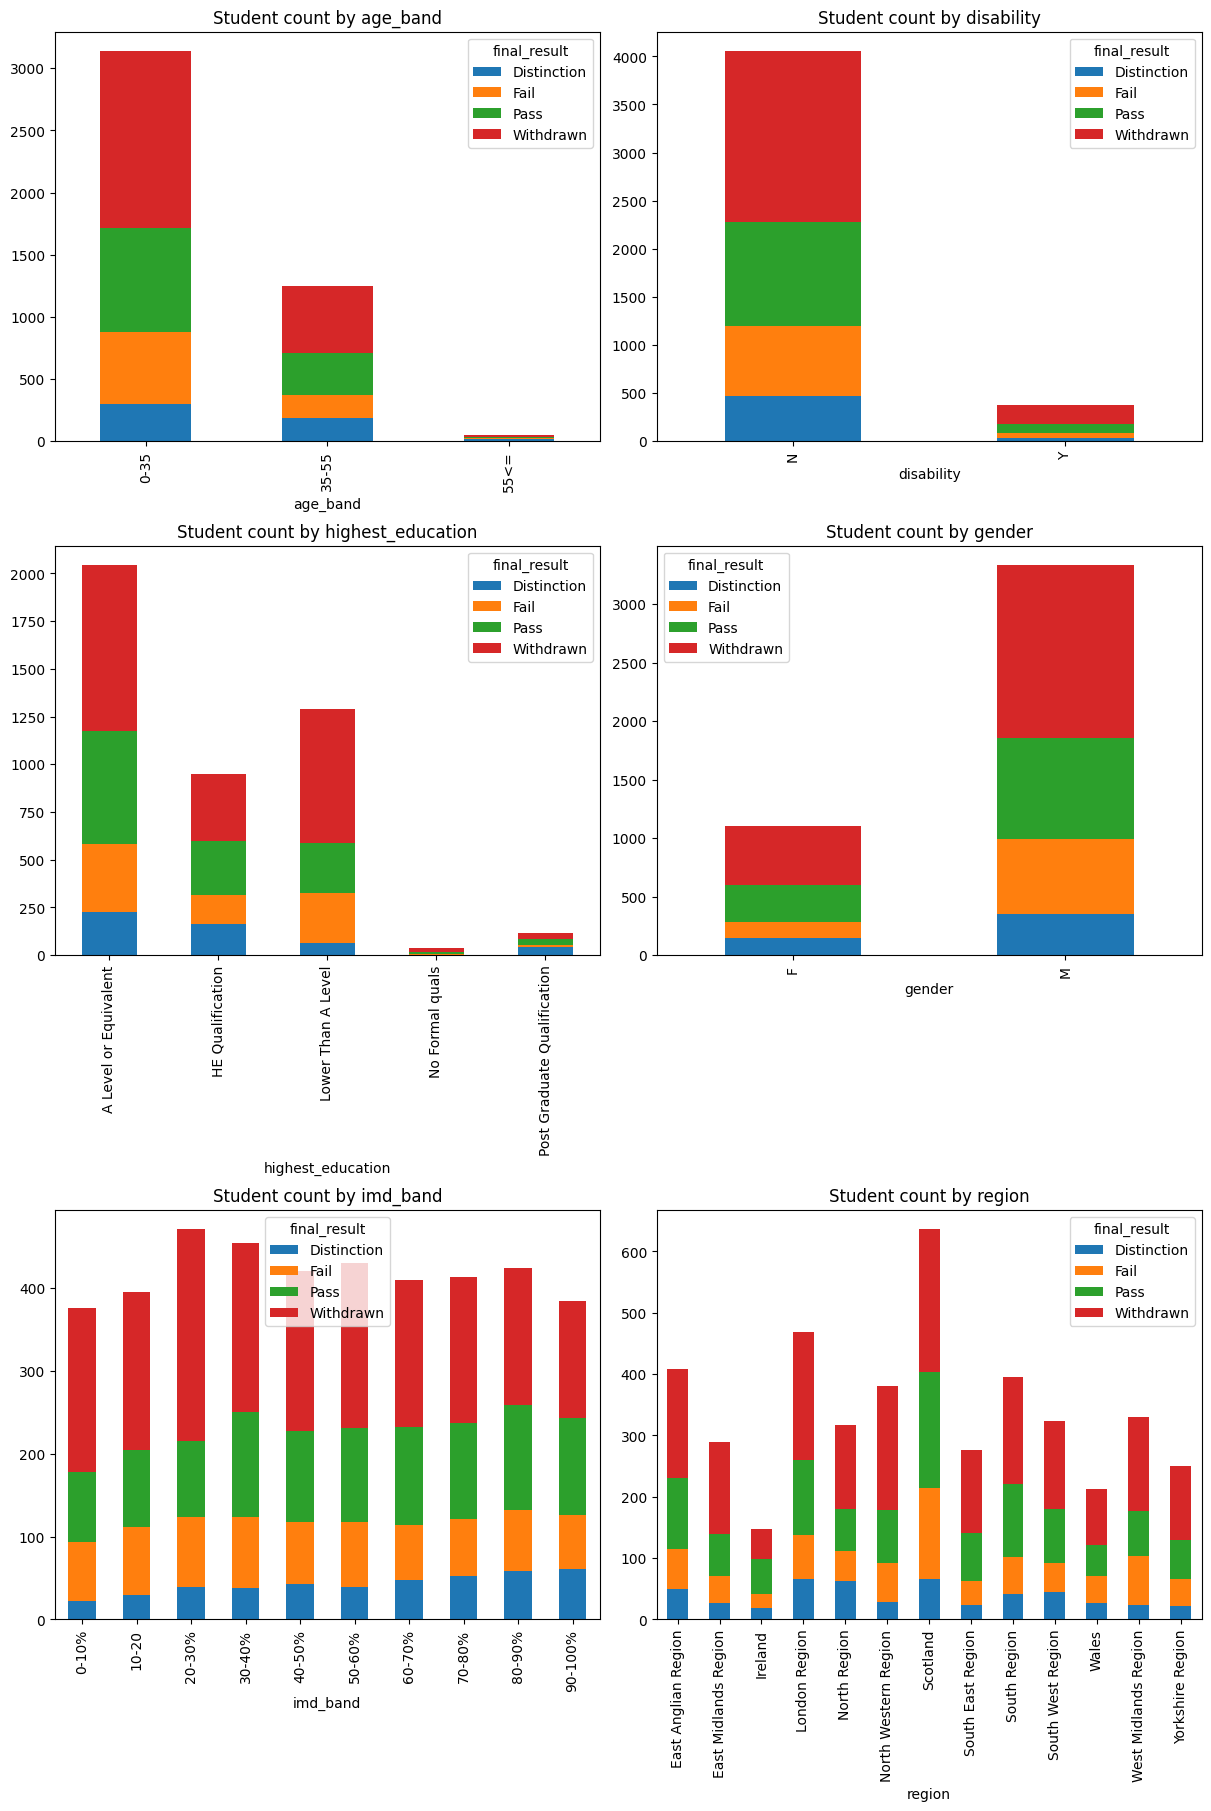
Student info attributes distribution for CCC module#
ccc_student_info = oulad.student_info[oulad.student_info.code_module == "CCC"].drop(
    "code_module", axis=1
)

fig, axes = plt.subplots(nrows=3, ncols=2, figsize=(12, 18), constrained_layout=True)

ccc_student_info.groupby(["age_band", "final_result"]).size().unstack().plot.bar(
    stacked=True, ax=axes[0, 0], title="Student count by age_band"
)
ccc_student_info.groupby(["disability", "final_result"]).size().unstack().plot.bar(
    stacked=True, ax=axes[0, 1], title="Student count by disability"
)
ccc_student_info.groupby(
    ["highest_education", "final_result"]
).size().unstack().plot.bar(
    stacked=True, ax=axes[1, 0], title="Student count by highest_education"
)
ccc_student_info.groupby(["gender", "final_result"]).size().unstack().plot.bar(
    stacked=True, ax=axes[1, 1], title="Student count by gender"
)
ccc_student_info.groupby(["imd_band", "final_result"]).size().unstack().plot.bar(
    stacked=True, ax=axes[2, 0], title="Student count by imd_band"
)
ccc_student_info.groupby(["region", "final_result"]).size().unstack().plot.bar(
    stacked=True, ax=axes[2, 1], title="Student count by region"
)
plt.show()
Notes#
The initial total number of students in the selected modules was 38239.
Students in a module presentation are organized into study groups of ~20 people.
Module resources are available from the VLE system a few weeks before the start.
If the final exam
dateis missing in theassessmentstable, it takes place during the last week of the module presentation.The structure of B and J presentations may differ.
In the
student_registrationtable, the student has withdrawn if thedate_unregistrationfield is present.If the student does not submit an assessment, no result is recorded.
The results of the final exam are usually missing.
An assessment score lower than 40 is interpreted as a failure.